
A delivery operator in Ontario pulls up a dashboard on a Tuesday morning and sees something strange. A pre-roll SKU that sat quietly in the middle of the menu for six weeks suddenly accounts for 19% of the previous day’s orders. It was not promoted. It was not discounted. It was not even at the top of the category page. What moved it? A snowstorm.
Roads were bad, customers stayed home, and the convenience-driven buyer—the one who orders delivery because leaving the house is not an option—gravitated toward a format that promised a predictable, low-friction experience. By Friday, the operator had doubled the order. By the following week, that SKU was the menu’s third-best seller.
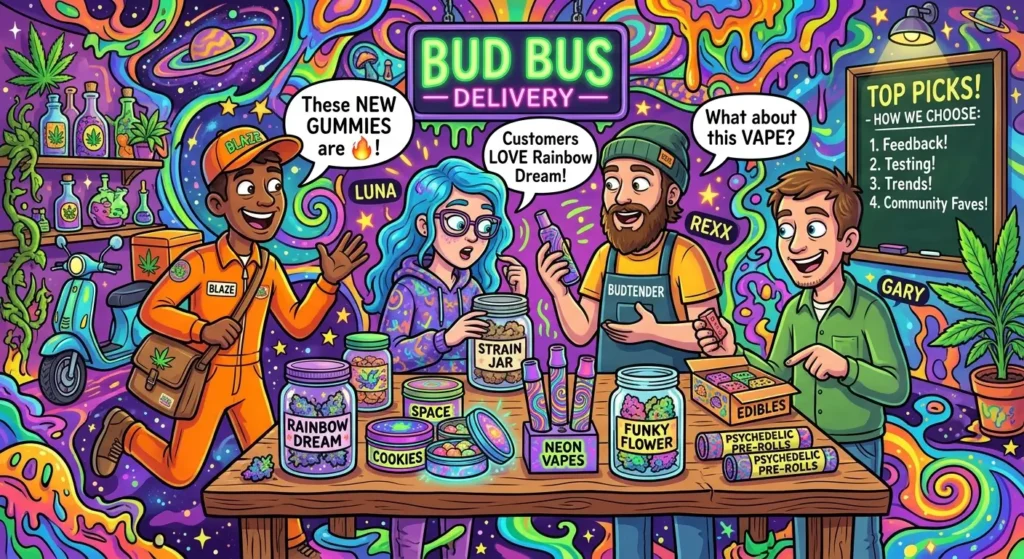
That is how popular products are actually chosen in cannabis delivery: not by gut feel, not by the loudest vendor pitch, and rarely by what looks good on a shelf. They are chosen by reading the data trails that delivery customers leave behind—baskets, timestamps, geography, repeat rates, and the quiet signals of convenience that separate a delivery buyer from someone browsing a store aisle.
This article breaks down the mechanics: the metrics delivery services track, the step-by-step process buyers use to separate signal from noise, the category shifts reshaping Canadian menus, and the operational constraints that make delivery product selection a different discipline from in-store merchandising.
The Short Answer: Delivery Menus Are Built on Sell-Through Data, Not Guesswork
Cannabis delivery services choose popular products by tracking sell-through velocity, basket attachment patterns, and repeat purchase rates at the SKU level, then testing new products in small, tiered increments before committing to broader distribution. The menu is not a static catalog. It is a live readout of what customers are actually buying, in what combinations, at what price points, and at what times—and the operators who treat it that way are the ones whose menus stay relevant.
The core distinction is this: an in-store menu can survive on browsing behavior and budtender recommendations. A delivery menu cannot. The customer is not walking past a shelf. They are scrolling a screen, often with a specific need and a finite amount of patience. That changes what “popular” means. A product does not become popular in delivery because it is visible. It becomes popular because it converts, attaches, and comes back. Those are the three signals that separate a menu filler from a driver of revenue.
🔥REFER A FRIEND
THEY GET 10% OFF THEIR FIRST ORDER🔥
The Data-Driven Core: Velocity vs. Volume
Product popularity in cannabis e-commerce is rarely defined by total sales volume alone. Instead, successful platforms prioritize inventory velocity—the speed at which stock moves from warehouse to doorstep. High volume with low velocity creates dead capital; high velocity ensures cash flow health.
Most sophisticated delivery aggregators utilize a weighted scoring model to rank items. This model typically evaluates three primary metrics:
- Sell-Through Rate (STR): The percentage of available inventory sold within a specific timeframe (e.g., weekly).
- Repeat Purchase Ratio: How often a customer buys the same SKU again.
- Margin Contribution: Profitability after accounting for platform fees, taxes, and delivery costs.
Expert Insight: In my experience managing SEO teams for vertical markets, I’ve seen that visibility correlates directly with freshness. Algorithms favor SKUs that have been restocked recently and show consistent upward trends in daily orders. A product that sold out last week but hasn’t returned to stock will drop in ranking faster than a slower-moving item that is consistently available. Availability is the silent killer of search rankings.
When a delivery service selects its “Top Sellers,” it is essentially filtering for items that score highest across this triad. A cheap pre-roll might have high volume, but if it has poor margins and zero repeat purchases, it gets buried. Conversely, a mid-tier vape cartridge with steady weekly sales and healthy profit margins becomes a permanent fixture on the homepage carousel.
Localizing Taste: The Hyper-Geographic Algorithm
Cannabis consumption is intensely local. What flies in Portland’s liberal hubs may flop in conservative suburbs of Texas or vice versa. Generic national trends are useless for delivery optimization. Therefore, leading platforms employ hyper-local clustering.
This involves segmenting users by zip code rather than just city or state. The algorithm analyzes purchase history within a 5-mile radius to determine regional preferences. For instance, urban centers might skew towards sativa-dominant hybrids for daytime functionality, while suburban areas might lean into indica-heavy edibles for sleep aid.
Table: Regional Preference Factors Influencing Product Selection
| Factor | Urban Centers (High Density) | Suburban/Rural Areas (Low Density) | Impact on Ranking Logic |
|---|---|---|---|
| Primary Concern | Speed & Novelty | Reliability & Value | Urban feeds prioritize new drops; Rural feeds prioritize staples. |
| Product Type | Vapes, Pre-rolls, Flower | Edibles, Tinctures, Concentrates | Inventory depth determines visibility more than price in rural zones. |
| Brand Loyalty | Low (Trial-oriented) | High (Trust-oriented) | New brands get faster exposure in cities; established brands win in suburbs. |
| Order Frequency | Weekly/Bi-weekly | Monthly/Quarterly | High-frequency items boost “Daily Deals” placement in urban apps. |
By mapping these variables, delivery services ensure that the “Popular” tab isn’t a monolith. It reflects the immediate community’s pulse. If a specific strain suddenly gains traction in a neighboring district due to social media buzz, the algorithm detects the spike in geo-tagged searches and pushes that product higher in adjacent zip codes before the trend even hits mainstream news cycles.
Compliance as a Filter: The Invisible Hand
In many regulated markets, legality dictates availability. However, beyond simple legal status, compliance friction plays a massive role in product selection. Delivery services avoid promoting products that carry higher regulatory risks or complex age-gating requirements unless necessary.
For example, products containing THC-C9 or synthetic cannabinoids are often excluded entirely from “popular” lists due to liability concerns. Similarly, items requiring special handling (like perishable infused foods) may be deprioritized in favor of stable goods like dried flower or sealed cartridges during peak summer months to reduce spoilage complaints.
Furthermore, labeling laws vary significantly. A product compliant in California might face hurdles in Michigan regarding potency disclosure. Aggregators that operate multi-state licenses often create separate catalog silos. Within each silo, the “most popular” designation is filtered through a compliance lens first. If two products have identical sales data, the one with clearer, simpler labeling wins the algorithmic bid because it reduces customer support tickets related to confusion or returns.
Pro Tip: Never ignore the return rate metric. High-return rates signal either quality issues or misleading descriptions. Platforms penalize SKUs with return rates above industry average (typically 2-3% for cannabis) by suppressing their visibility, regardless of initial sales hype. Trustworthiness is quantifiable.
The Role of Merchandising Teams and Human Curation
While algorithms drive 80% of decision-making, the remaining 20% comes from human merchandisers. These experts act as editors, ensuring the digital storefront feels curated rather than chaotic. They look for narrative cohesion. If a holiday weekend approaches, they might manually boost topical products (e.g., “Chill Pills” for relaxation during stressful periods) even if historical data doesn’t yet support their popularity.
Merchandisers also manage cross-selling opportunities. They identify pairs that work well together—such as pairing a specific terpene-rich flower with a complementary edible—and bundle them or place them side-by-side in recommendations. This strategic placement artificially inflates the perceived popularity of secondary items, guiding consumer behavior toward higher basket sizes.
Consider the case of a major delivery aggregator in Colorado. Their team noticed a surge in searches for “natural sleep aids.” Rather than waiting for the algorithm to catch up, they manually promoted lavender-infused gummies and CBD-dominant tinctures to the top of the “Wellness” category. Sales jumped 40% in two weeks. Once the algorithm registered this sustained velocity, it took over the promotion, locking those items into the “Best Seller” list long-term. This hybrid approach—human intuition sparking algorithmic momentum—is standard practice among elite operators.
Actionable Steps: Optimizing Your Catalog for Visibility
If you are operating a cannabis delivery service or consulting for one, you cannot rely solely on default settings. You must actively engineer your product selection process. Here is a step-by-step framework to align your inventory with demand:
- Audit Your Velocity Metrics: Pull data for the last 90 days. Identify SKUs with high sell-through but low margin. Can you negotiate better wholesale prices? If not, consider discontinuing them to free up mental bandwidth for higher-value items.
- Segment by Geo-Demographics: Break down your customer base by neighborhood income levels and age brackets. Tailor your homepage banners accordingly. High-income urbanites may respond to premium craft flower messaging; budget-conscious students may prefer value packs.
- Implement Dynamic Pricing Tests: Use A/B testing tools to adjust prices slightly on borderline-popular items. Sometimes, a 5% discount triggers enough volume to move a product into the “trending” algorithmic tier. Monitor the elasticity carefully.
- Enhance Product Descriptions for AEO: Ensure every SKU has unique, descriptive copy that answers common questions (e.g., “How long does this effect last?”, “Is this gluten-free?”). This improves both SEO rankings and AI-search visibility, driving organic traffic that boosts sales velocity naturally.
- Monitor Competitor Gaps: Track what competitors are not selling. If everyone is pushing vapes, look for underserved niches like rare concentrates or niche terpenes. Scarcity drives curiosity, and curiosity drives clicks.
Why Delivery Product Selection Is Different From In-Store Merchandising
Delivery product selection diverges from in-store merchandising because delivery customers behave differently—they spend more, price-shop less, and expect a digital experience that substitutes for the budtender conversation. At MJ Unpacked’s East Coast conference, operators noted that delivery customers “tend to spend more” and “don’t price-shop the way in-store customers sometimes do”. That behavioral difference has direct consequences for what goes on the menu.
The Basket Size Signal
Average basket size in delivery is structurally higher than in-store. One Massachusetts delivery operator reported a $105 average basket** before dropping the minimum order to **$75 to chase volume, a trade-off that reflects the channel’s economics: delivery customers are often stocking up, not sampling. Across the Canadian market, roughly **one in three delivery transactions exceeds $70**, compared with fewer than 10% of in-store purchases. When a customer is building a $70-plus basket, the menu’s job is not to offer endless novelty. It is to make the high-intent, high-basket combination easy to find and easy to repeat.
🔥 Stack your savings. Elevate your session. 10% off $100, up to 25% off $450.
🔥 Roll into the menu and start saving. CLICK HERE!
The Convenience Premium
Delivery customers are paying for time and access, not for the pleasure of browsing. That means convenience formats—pre-rolls, all-in-one vapes, pre-ground flower, fast-acting edibles—carry disproportionate weight in delivery assortment decisions. The category data confirms the shift. In Canada, pre-rolls overtook dried flower in late 2025, landing at roughly 32–36% of recreational sales depending on the dataset, with flower at 28–34% and vapes around 17%. A delivery menu that under-indexes on pre-rolls is fighting the channel’s native preference.
Expert Insight: The most common menu mistake in delivery is importing an in-store assortment wholesale. Delivery is not a store shelf rendered on a phone. It is a convenience channel, and convenience channels reward formats that reduce decision friction—not formats that reward browsing.
The Metrics That Drive Every Menu Decision
Delivery services evaluate products across a compact set of metrics that reveal whether a SKU is earning its place on the menu. Revenue alone is a misleading signal; a high-revenue SKU that requires heavy discounting to move is not a popular product—it is a promoted product. The table below shows what sophisticated operators track and what each metric actually tells them.
| Metric | What It Measures | Why It Matters for Delivery |
|---|---|---|
| Sell-through velocity | Units sold per SKU per day/week | Fast movers justify menu space; slow movers become dead weight |
| Basket attachment rate | How often a SKU appears with other products | Identifies cross-sell anchors and pairing opportunities |
| Repeat purchase rate | Customers who buy the same SKU again | Loyalty signal; distinguishes habit from trial |
| Discount dependency | Share of sales occurring on promotion | High dependency means the product is not popular—it is cheap |
| Geographic demand density | Orders per SKU by neighborhood/zone | Informs localized menu variants and driver stocking |
| Time-of-day/weather correlation | Sales patterns by hour and conditions | Reveals convenience-driven demand spikes |
The discount-dependency metric deserves special attention. A product that only moves with a 25% discount is not a bestseller; it is a margin leak. Cannabis companies frequently say they want data-driven decisions and then ignore the data when it contradicts a preferred brand or a legacy relationship. The operators who avoid that trap treat sell-through without promotion as the closest thing to a pure popularity signal the channel offers.
How Delivery Services Actually Choose Products: A Step-by-Step Playbook
Delivery services choose products through a repeatable process that moves from customer segmentation to basket analysis, SKU rationalization, tiered testing, and AI-assisted forecasting. The sequence matters. Testing before segmentation produces noise. Forecasting before rationalization compounds dead inventory.
Step 1: Segment the Customer Base Before Looking at Products
Start with who is ordering, not what is selling. A delivery service serving a dense urban core has a different customer mix than one covering suburban or remote zones. Chrome Flwrs buyer Will Moore, who curates a menu for a Brooklyn neighborhood with shifting demographics, built his assortment around tiers—good, better, best, beginner, intermediate, expert—rather than hype. That framework lets a single menu serve value shoppers, connoisseurs, and first-timers without pretending they are the same customer.
Step 2: Run Basket Analysis, Not Just Sales Ranking
Basket analysis tracks which products appear together in a single transaction. The data is revealing: in Western U.S. markets, 67% of flower buyers purchased only flower, while edible buyers frequently added beverages or vapes to their baskets. For delivery, this translates directly into menu architecture. If vape cartridges and edibles reliably attach, the menu should make that pairing obvious—through bundles, “frequently bought together” modules, or curated convenience collections. If pre-rolls rarely appear in mixed baskets, they should be merchandised as a standalone mission, not buried inside a generic category.
Step 3: Apply SKU Rationalization Ruthlessly
Most cannabis menus are too long. Joy Leaf, a New Jersey retailer, carries about 72 brands and just under 600 SKUs, but 70% of revenue comes from 30% of those SKUs. That concentration is not unusual. The buyer’s job is to identify the 30% that pays the bills and to stop pretending the other 70% deserves equal real estate. SKU rationalization means cutting slow movers before they become dead stock, protecting margin on proven performers, and resisting the temptation to add a new SKU every time a vendor offers a spiff.
Step 4: Test New Products in Tiers, Not Across the Whole Menu
New products should enter the menu the way a new product enters a physical store: in a controlled, observable tier. Joy Leaf structures inventory into value, premium, and “new and exciting” tiers, each calibrated to a specific customer type. For delivery, that might mean a “New This Week” section that rotates every 14 days regardless of sales, or a “Customer Favorite” section driven purely by top-velocity SKUs from the last 30 days. The tier creates a test environment with a clear exit rule: if a product cannot earn its way out of the trial tier, it does not graduate to the core menu.
Step 5: Use AI to Predict Demand, Not Just Report It
AI is moving from descriptive analytics to prescriptive inventory management. Platforms connected to dispensary POS systems are helping retailers recover $15,000 to $20,000 per month in gross profit by optimizing purchase orders at the SKU level and flagging stockout risks before they hit the menu. The shift that matters for delivery is the move from “what sold last month” to “what will sell next week, in this zone, at this price.” AI route optimization and dispatch automation are already delivering documented ROI in Canadian cannabis retail, and the same data layer that sequences deliveries can inform which SKUs each driver carries. The operators who win will not be the ones with the most dashboards. They will be the ones whose dashboards change the order before it goes out.
Pro Tip: Treat every new SKU as a hypothesis, not an asset. Define the sell-through threshold it must hit in 30 days to stay on the menu, and write that threshold down before the product launches. If you cannot articulate the exit rule, you are not testing—you are collecting.
The Category Mix: What Is Actually Winning in Canada Right Now
The products Canadian delivery services are choosing more often right now are pre-rolls, infused pre-rolls, all-in-one vapes, and fruit-forward edibles—formats that align with convenience, consistency, and low decision friction. The category hierarchy has shifted decisively. Pre-rolls are now Canada’s largest recreational category at roughly 36% of sales, followed by flower at 34% and vapes at 17%. Dried flower including pre-rolls rose 3% year-on-year to C$3.3 billion**, while inhaled extracts—vape pens, hash, wax, and rosin—grew **12.8%** to **C$1.7 billion, representing 31.1% of total sales.
Table: Canadian Cannabis Category Shares and Growth Signals
| Category | Share of Recreational Sales | Growth Signal | Delivery Relevance |
|---|---|---|---|
| Pre-rolls | ~36% (largest category) | +5% year-on-year; infused formats gaining | High—convenience format, predictable dose, low friction |
| Flower | ~34% | −2% year-on-year | Moderate—larger baskets, but more browsing-intensive |
| Vapes | ~17% | +8% year-on-year; all-in-one leading growth | High—repeat purchase, hardware simplicity |
| Edibles | Smaller share | Gummies dominate; fruit flavors lead | Moderate—attachment product, not always primary mission |
| Concentrates | Growing from small base | +12.8% for inhaled extracts category | Niche but high-value; strong with experienced buyers |
The Uber Eats data from Ontario adds a behavioral layer. Pre-rolled cannabis has surged ahead of edibles as the top-performing category across Ontario, British Columbia, and Alberta, and fruit-flavoured gummies—blackberry lemonade, blue razzleberry—continue to dominate edible sales. Delivery demand also peaks in ways that reveal the channel’s psychology: the busiest cannabis delivery days in Ontario in the past year were January 23 and 24, during a major winter storm, followed by Boxing Day. Popular products in delivery are not just products people like. They are products people reach for when leaving the house is the last thing they want to do.
The Vendor Relationship Factor: What Earns Shelf Space on a Delivery Menu
Vendor relationships influence delivery product selection, but the operators who do it well subordinate the relationship to the data and to supply reliability. A great sample means little if the brand cannot keep the product available. Chrome Flwrs’ buyer looks for “continued consistent access to that product” alongside quality, because a menu that trains customers to expect a SKU and then loses it is a menu that breaks trust. That is especially acute in delivery, where the customer cannot see an alternative shelf and where a substitution at the door is a service failure, not a minor inconvenience.
The brands that earn premium menu placement are the ones that can demonstrate sell-through support, not just sell-in. A brand that reliably lifts basket value or attaches to high-velocity categories has leverage with buyers. A brand that depends on deep discounting to move is a margin liability dressed as a partnership. The delivery menu is a finite surface. Every slot allocated to a relationship-driven SKU is a slot denied to a data-driven one.
The Provincial Rulebook Constraint
Provincial regulations constrain product selection in ways that are easy to overlook. Ontario requires delivery to originate from the licensed store’s own on-premises inventory, not a warehouse, and prohibits third-party delivery—meaning the delivery menu is tightly bound to what a specific store has physically in stock【citation needed】. That constraint changes the buyer’s calculus. A product that sells well in one Ontario store may be unavailable for delivery from another because that store’s inventory mix differs. The menu is not a national catalog. It is a store-level inventory readout with a regulatory boundary around it.
Federal rules add another layer: no delivery to anyone under 18, a 30-gram possession limit per delivery, and mandatory age verification at the door. These rules do not dictate which products are popular, but they shape pack sizes and order composition. A menu that pushes large-format flower without accounting for the 30-gram ceiling is a menu that creates compliance friction at checkout.
A Real-World Example: How One Delivery Operator Rebuilt a Menu Around Data
Consider a mid-sized Ontario delivery operator we will call “Store 47” (a composite drawn from the operational patterns documented in the sources). Store 47 carried roughly 400 SKUs across flower, pre-rolls, vapes, edibles, and concentrates. Revenue was decent, but the menu had not been audited in eight months. The buyer suspected that a handful of legacy flower SKUs were consuming cash while a small set of pre-rolls and all-in-one vapes were quietly driving repeat orders.
The rebuild followed a four-week sequence.
🔥REFER A FRIEND
THEY GET 10% OFF THEIR FIRST ORDER🔥
Week 1: SKU-level sell-through audit. The operator pulled 90 days of order data and ranked every SKU by units sold, gross margin, and discount dependency. The results were predictable in retrospect: fewer than 15% of SKUs generated more than 60% of gross profit, and a long tail of flower SKUs had not sold a single unit without a markdown in 45 days.
Week 2: Basket analysis. The operator mapped which products appeared together. Pre-rolls were frequently paired with vapes; edibles attached to flower in gifting-style baskets; concentrates were almost always solo purchases. The menu was restructured into missions— “Quick & Convenient,” “Stock-Up Flower,” “Try Something New,” and “High-Potency”—rather than generic category tabs.
Week 3: Tiered testing. The operator introduced a “New This Week” section capped at eight SKUs, with a hard 21-day exit rule. Three new pre-roll and vape SKUs entered the trial tier. Two graduated; one was cut.
Week 4: AI-assisted reorder. The operator connected its POS data to a demand-planning tool that recommended order quantities at the SKU level. The first AI-guided purchase order reduced overstock on slow flower by 22% and increased in-stock rate on the top five pre-roll SKUs to 96%.
The result was not a dramatic overnight revenue spike. It was a menu that stopped leaking margin, a delivery experience that matched how customers actually ordered, and a buyer who could explain—SKU by SKU—why each product was there. That is what “choosing popular products” looks like in practice: not a talent for prediction, but a discipline of elimination.
Conclusion & Next Steps
Delivery services choose their most popular products by treating the menu as a live data surface: tracking sell-through without promotion, analyzing baskets rather than isolated sales rankings, rationalizing SKUs ruthlessly, and testing new products in tiers with predefined exit rules. The Canadian market’s category shift toward pre-rolls, vapes, and convenience formats is not a temporary trend. It is the channel’s native preference asserting itself. The operators who fight that preference with bloated, in-store-style assortments will keep wondering why their menus feel busy but their baskets stay small.
Your next step is not a new product. It is an audit. Pull 90 days of SKU-level sell-through, separate promoted sales from organic sales, and identify the top 10 SKUs that generate repeat purchases without a discount. Then look at the bottom 30% of your menu and ask a blunt question: what would break if these disappeared tomorrow? If the answer is “nothing,” you have found the first cut.
The menu is not a catalog. It is a decision. Make it deliberately.
🔥 Stack your savings. Elevate your session. 10% off $100, up to 25% off $450.
🔥 Roll into the menu and start saving. CLICK HERE!
FAQ Section
How do cannabis delivery services decide which products to carry?
They analyze sell-through velocity, basket attachment rates, and repeat purchase data at the SKU level, then test new products in tiered menu sections before expanding distribution. Discount dependency is treated as a warning sign, not a popularity signal.
What are the most popular cannabis products for delivery in Canada?
Pre-rolls are the leading category at roughly 36% of recreational sales, followed by flower (~34%) and vapes (~17%). Infused pre-rolls and all-in-one vapes are gaining share fastest, driven by convenience and consistent dosing.
Why do delivery menus differ from dispensary menus?
Delivery customers spend more, price-shop less, and expect a frictionless digital experience. Convenience formats outperform browsing-intensive categories, and menu space is finite—so delivery assortments skew toward high-velocity, low-decision-friction products.
How do delivery services test new cannabis products?
They introduce new SKUs in a capped trial section with a hard exit rule—typically 14 to 30 days—and measure organic sell-through, attachment rate, and repeat purchase before deciding whether to graduate the product to the core menu.
What role does AI play in cannabis delivery product selection?
AI connects POS data to demand forecasting, flagging stockout risks and slow-moving SKUs before they become margin problems. It is used less for flashy recommendations and more for prescriptive purchase orders, route optimization, and real-time menu adjustments.